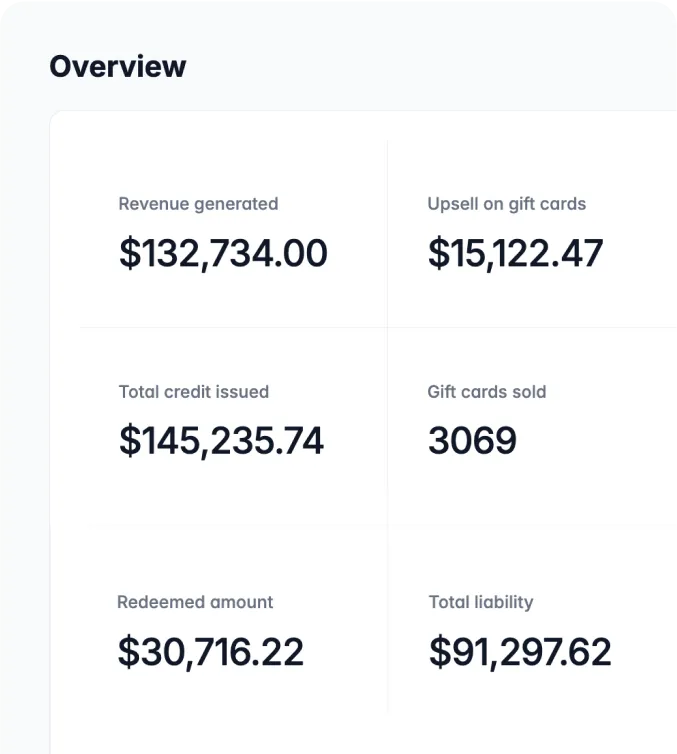
Almost every gift card program I see reports a single headline number: cards sold, or total face value issued. It is the easiest number to produce and the least useful one available. It tells you what happened at the point of sale and nothing about whether the program is working.
A gift card is only half a transaction. You have taken money for something you have not yet delivered. The interesting questions all live on the other side of that, whether the card comes back, how fast, through which channel, and what the holder does when they arrive. Those are the numbers that tell you whether to invest more.
Which gift card metrics are worth tracking?
Seven, in the order they usually matter. None of them require anything more exotic than your issuance and redemption data.
| Metric | How to calculate it | What a movement is telling you |
|---|---|---|
| Attach rate | Gift card transactions ÷ total transactions, per channel | Whether the card is actually being offered. A low in-store rate with a healthy online rate is nearly always a staff prompting problem, not a demand problem. |
| Redemption rate | Value redeemed ÷ value issued, measured by issue cohort | Whether cards are coming back at all. Measured across the whole book it is meaningless, because recent issuance drags it down. |
| Time to first redemption | Median days between issue and first redemption | How quickly the liability converts. The most under-used number on this list, see below. |
| Overspend at redemption | Average basket on a redeeming transaction ÷ average card value | Whether the card is bringing a full customer or just discharging a balance. |
| Outstanding liability | Total issued − total redeemed | What you owe. This is a balance sheet figure, not a marketing one, and finance needs it monthly. |
| Liability aging | Outstanding balance bucketed by last-activity date | Which balances have gone quiet. Drives both breakage estimation and escheat obligations. |
| Channel split | Issuance and redemption by channel, side by side | Where cards are bought versus where they are spent. Rarely the same place, and the gap is the argument for omnichannel. |
Why is "cards sold" the wrong headline number?
Because it rewards the wrong behaviour. A program optimised for cards sold will discount to move volume, and discounting a gift card means selling a dollar for less than a dollar with no guarantee the holder ever returns. You can grow that number indefinitely while destroying margin.
Cards sold also hides the failure mode that actually kills gift card programs, which is cards that never come back. An unredeemed card is not a win. It is a liability sitting on your balance sheet, and a customer who was introduced to your business and did not show up.
What is redemption rate really telling you?
Only if you measure it by cohort. Take every card issued in a given month and track that group forward. Cards issued last week have not had time to be redeemed, so folding them into a single blended figure guarantees a number that falls whenever sales rise. The opposite of what is really happening.
Industry-wide, somewhere between 5% and 15% of total face value is never redeemed, and that estimate is what your finance team will use for breakage. We go through how that flows into revenue recognition under ASC 606 and IFRS 15 in the gift card accounting and liability guide. For the marketing side, the useful reading is directional: a cohort that redeems faster than its predecessors means the program is getting healthier, whatever the absolute number.
The metric most programs ignore: time to first redemption
If I could get every merchant to add one number to their reporting, it would be this one. The median gap between issuing a card and the holder first spending against it tells you more about program health than redemption rate does, and it tells you sooner.
It is a leading indicator. Redemption rate takes a year to become meaningful. Time to first redemption starts moving within weeks, and it responds to things you actually control: whether the card is easy to find when the recipient wants it, whether it works on the channel they tried first, whether the recipient understood what they had been given.
When that number gets worse, the cause is almost always friction rather than demand. A card the recipient cannot locate in their inbox four months later is functionally lost. That is why mobile wallet support matters more than it sounds like it should: a card in Apple Wallet or Google Wallet surfaces when the customer is standing in your shop, and one buried in an email thread does not.
What does the channel split tell you?
Issuance and redemption almost never happen in the same place. Cards are bought online and spent in store, or bought at the counter as an afterthought and spent on the website. Putting the two side by side is the fastest way to see whether your program is genuinely omnichannel or just technically multi-channel.
The failure this exposes is a card sold on one channel that cannot be redeemed on another. Nodo hit exactly this before moving to Wrapped, customers arriving in store with a digital card the till could not accept, and staff having to void balances and reissue by hand. They reported redemption up 30% after the balance became shared across channels. Nothing about demand changed. The friction did.
How often should you look at these?
Outstanding liability and aging are monthly, because finance needs them for close. Attach rate is weekly if you are actively working on it and monthly otherwise. It is the one that responds to staff prompting, so it needs a feedback loop short enough for the team to feel. Cohort redemption and time to first redemption are quarterly; they move too slowly to be worth watching more often, and checking them weekly just generates noise.
Calculate overspend properly once, then re-check it a couple of times a year. Across Wrapped merchants, customers spend on average 2–3x the value of the card when they redeem it. If your number is close to 1x, the card is being spent like a coupon rather than bringing a full basket, and that usually points at how you're marketing it rather than at the card itself.
What good reporting looks like
Three views, and no more. A monthly liability report for finance, broken down by channel and aged by last activity. A weekly attach rate by site and channel for the operations team. A quarterly cohort view for whoever owns the program's growth.
If producing those takes manual work, that is its own finding. It usually means balances live in more than one system and someone is reconciling by hand. Wrapped reports all of these against a single shared balance, which you can see in the feature overview, and pricing is published in full on the pricing page.
This is general information for operators and finance teams, not accounting advice. Talk to your accountant about how breakage and liability should be treated in your jurisdiction.